Gantt Chart: Functions, Advantages, and Examples
In short: A Gantt chart visualizes your project timeline as a horizontal bar chart, displaying tasks, dependencies, and milestones while making project progress immediately visible. In this article, you will not only learn the basics of creating a Gantt chart, but also advanced techniques for managing task dependencies, navigating the critical path, and resolving resource conflicts. Read on if you want to take your project management to the next level and use tools like Excel or Procoli Mini as your practical assistants.
Why this article is worth your time: I write as a project management expert, provide you with actionable concepts and a Gantt diagram example, highlight mistakes project managers often overlook, and supply quotes from recognized sources with links so you can quickly dive deeper.
What is a Gantt chart and what do you use this diagram for?
Straight to the point: A Gantt chart represents tasks as horizontal bars on a timeline, shows start and end dates, and visualizes dependencies between tasks. Henry Gantt laid the foundation for this visualization; today, Gantt charts help teams view the entire project plan from start to finish.
The diagram visualizes tasks, their duration, milestones, and resources. A clear project timeline brings transparency: You can see which individual task could delay the schedule, which dependencies are critical, and where buffers are needed. Effective Gantt charts use colored bars, milestone symbols, and arrows for dependent tasks.
Smartsheet describes a Gantt chart as a "visual project management tool that displays project tasks against a timeline," which strongly supports teams in planning and tracking tasks. (Source: Smartsheet – What is a Gantt Chart)

Step-by-Step Gantt Chart Creation
Step 1: Define the project scope and list all tasks and subtasks. Build a Work Breakdown Structure (WBS) so you can clearly name every single task.
Step 2: Assign start and end dates. Create the timeline and enter horizontal bars for each task. Keep it organized: Too many details will clutter the diagram. Therefore, visualize main tasks and display smaller subtasks on a separate layer if needed.
Step 3: Link tasks using dependencies (Finish-to-Start, Start-to-Start, etc.). Mark milestones as diamonds and add buffers for uncertain tasks. Always use versioning when creating Gantt charts so that you can track changes over time.
Tip from the Project Manager
First, create a rough project timeline, then iterate for detailed planning. This prevents hours of adjustments when framework conditions change.
Different Types of Dependencies Explained
- Finish-to-Start (FS) — Standard dependency: Task B starts after Task A is finished. Example: "Development" (A) → "Testing" (B). Use FS when a subsequent task physically depends on the completion of the preceding one.
- Start-to-Start (SS) — Two tasks start simultaneously or with a defined offset. Example: "Backend Development" starts as soon as "Frontend Base Structure" begins. Use SS when tasks run in parallel but need to start synchronized.
- Finish-to-Finish (FF) — Two tasks must end at the same time. Example: "Documentation" (A) must be finished together with "Release Preparation" (B). FF is suitable when approval or completion must happen synchronously.
- Start-to-Finish (SF) — Rare; Task B ends when Task A starts. Example: Shift handovers or legacy scenarios. Use SF only for clear processes that explicitly require it.
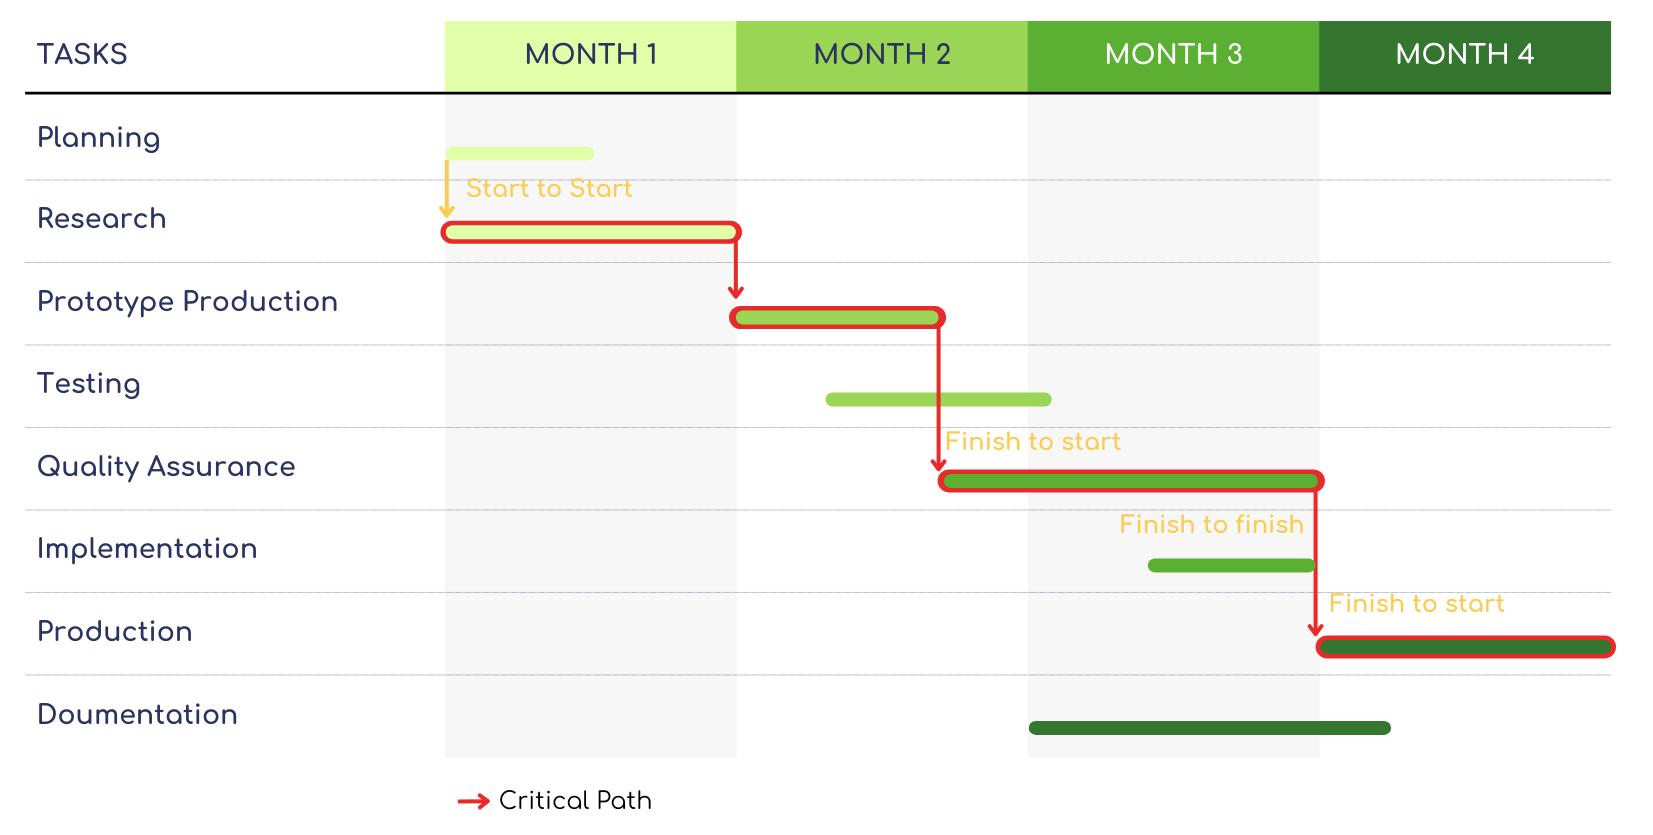
Example of a Project Timeline
The following Gantt diagram example illustrates a realistic project with eight phases spanning four months. The red arrows mark the critical path—any delay on this path will postpone the overall project completion. Furthermore, the different dependency types (Start-to-Start, Finish-to-Start, Finish-to-Finish) are explicitly labeled right in the diagram.
What Functions Do Gantt Charts Offer?
A Gantt chart offers several key functions: visualizing the project timeline, displaying task dependencies, highlighting milestones, and tracking project progress. These functions help you manage the project plan and keep stakeholders quickly informed.
- The visual representation of the entire project timeline simplifies communication.
- Gantt charts allow for the identification of bottlenecks and critical paths.
- You actively visualize resource utilization and detect overloads early.
- Milestones enable quick status checks for management.
From a project management perspective, Gantt charts provide a clear project plan: They keep the team on course and give decision-makers immediate transparency regarding the completion of individual tasks and the project as a whole.
Expert quote: Microsoft Project Documentation describes Gantt charts as a central tool for task scheduling and strongly recommends their use for managing complex project plans. (Source: Microsoft Learn – Gantt in Project)
What Are the Advantages and Disadvantages of Gantt Charts?
Comparing pros and cons fairly: Gantt charts offer powerful visualization, but they do have limitations, especially in highly complex projects with massive dependency networks.
Advantages
- Clear, visual representation of the project timeline.
- Direct visualization of task dependencies.
- Easy tracking of project progress and milestones.
- Greatly supports communication with broad stakeholder groups.
Disadvantages
- Gantt charts can quickly become overly large and cluttered with too many subtasks.
- Maintaining start dates, end dates, and dependencies requires high discipline.
- Basic Gantt views do not provide deep risk analysis; you should supplement them with FMEA or thorough critical path analyses.
- In highly dynamic projects, manual updates drain your time unless you use tools featuring task automation.
Practical Advice:
For large projects, combine your Gantt chart with a clear Work Breakdown Structure and a resource plan. This keeps the diagram navigable and easy to control.
How to Visualize Task Dependencies and Milestones in Gantt Charts?
Task dependencies in a Gantt chart appear as arrows connecting the bars. Clearly mark the four standard dependencies: Finish-to-Start, Finish-to-Finish, Start-to-Start, and Start-to-Finish. Use short, clear labels for dependent tasks so the entire team grasps the connections instantly.
Milestones appear as diamond icons or solid vertical lines on the timeline. Set milestones for critical decisions, major deliverables, or major reviews. Manage milestones actively: They define the actual project progress and signal the successful completion of entire project phases.
Practice Hack
Color-code dependency-critical tasks and add comments with well-founded risk assessments. This shifts the project discussion from "gut feelings" to a data-driven approach.
How Do You Find the Critical Path in the Schedule and Why Is It Critical?
The critical path emerges from the chain of tasks that possess absolutely zero buffer; any delay in this path delays the entire project. Calculate the earliest start dates and latest end dates, calculate buffers, and mark all tasks with zero slack as critical.
Identify the critical path in the Gantt chart using distinct color markings. Monitor these specific tasks daily because they directly govern the project timeline. When facing a resource bottleneck, always prioritize critical path tasks so your project stays on track.
Tip from the Project Manager
Conduct weekly reviews focusing solely on the critical path. This saves time and directly completely addresses the most dangerous bottlenecks that could stop the entire project.
How Do You Manage Project Progress and Update Your Diagram?
Update your Gantt chart regularly. Make use of quick status updates (e.g., 0%, 50%, 100%) for individual tasks. Enter "Task Completed" as a documented milestone and let the software shift dependent tasks automatically if feasible.
If you are working with Excel, use tables as your data source and automate the rendering of bars utilizing specific formulas or templates. With professional tools, the system automatically updates the project progress precisely when team members mark their work as done.
Procoli Mini to the rescue: Procoli Mini takes over communication with external partners via link-based collaboration. Link tasks in your Gantt chart with Procoli tasks, request required evidence (photos, logs) automatically, and receive updates directly in your project task. This ensures your Gantt diagram and tracking stay accurate and actionable.
Creating an Excel Gantt Chart
Excel is suitable for generating a simple Excel Gantt chart: Use a straightforward table outlining tasks, start dates, and end dates, calculate durations, and build a stacked bar chart. Format the very first visual data series as transparent so the actual second series appears exactly as horizontal task bars.
Step-by-Step: Create columns for the task name, start date, duration, and completion progress. Utilize a stacked bar chart: The first layer acts as the start offset, and the second layer represents the exact task duration as a visible colored bar. Include data labels highlighting key milestones.
Disadvantages of Excel: If you have massive task interdependencies, tracking changes remains highly limited. For intensive task dependencies and tracking the critical path effectively, switch to specialized software, or combine Excel with Procoli Mini tasks to easily export and share status updates for improved collaboration.
Which Tools Are Powerful for Complex Projects and Gantt Charts?
For complex initiatives, rely on specialized Gantt chart tools: Microsoft Project handles enterprise-level planning, Smartsheet enables highly collaborative scheduling, Atlassian plugins master Jira workflows, and modern SaaS setups integrate deep resource planning. These apps visualize and effectively manage sprawling project plans, complex dependencies, and tightly allocated resources.
Choose a tool grounded on specific criteria: Scalability, integration capabilities (e.g., securely linking with Procoli Mini for external interactions), automatic timeline adjustments, and built-in critical path calculations. Run dedicated test projects using real-world data before making the tool a permanent standard. In the full version of Procoli, you'll benefit from having all these vital functions neatly unified in a single interface.
Expert Insight: Atlassian demonstrates that Gantt charts empower teams to securely manage dependencies and accurately communicate holistic project plans—a massive advantage when coordinating cross-functional teams. (Source: Atlassian – Gantt Chart Article)
Frequently Asked Questions (FAQ)
What is the concrete difference between a Gantt chart and a standard bar chart?
A Gantt chart specifically displays scheduled tasks along a horizontal timeline; a regular bar chart primarily enables quantity comparisons. Gantt diagrams explicitly render start dates, end dates, workflows, and task dependencies.
Is a Gantt chart suitable for large, highly complex projects?
Yes, but for extensive numbers of tasks, supplement the chart with a clear Work Breakdown Structure (WBS), deep resource plan, and intensive filtering mechanisms to ensure the diagram remains navigable.
How often should I officially update a Gantt chart?
Update the central diagram at least weekly; scrutinize and update tasks residing on the critical path every single day.
How do I accurately depict task dependencies in an Excel Gantt chart?
Excel does not automatically visualize rigid dependencies out-of-the-box; forcefully mark logical dependencies utilizing overlay arrows, or link designated task values strongly via cell formulas. For automated dependency shifts, utilize specialized Gantt software.
What happens exactly when a task inevitably delays the critical path?
Act immediately: Reprioritize assigned resources, heavily investigate technical substitutions or stop-gap measures, and promptly recalibrate the entire project timeline.
How do I easily integrate external partners without deploying extra logins?
Capitalize on link-based external collaboration solutions like Procoli Mini. External vendors interact simply via encrypted links, comfortably upload essential evidence, and discuss aspects right inside the specific task timeline.
What is the absolute best way to visually establish milestones?
Embed recognizable diamond icons or highly visible vertical lines directly onto the timeline tracking, carefully tying the targeted milestones securely to their underlying task dependencies.
What are common, powerful alternatives to Gantt charts?
Kanban boards manage flexible agile workflows cleanly, Program Evaluation and Review Technique (PERT) manages uncertain event schedules effectively, and simplified Timeline Views assist in various modern digital tools.
Practical Pro Tips
Always prioritize firm dependencies over static dates. Only hardcode rigid deadlines if absolutely unchangeable. Utilize a Baseline – so you can effectively compare Plan vs. Actual and determine your precise Schedule Variance. Clearly mark the critical path: Associated tasks heavily impact your ultimate end date straight away. Strictly utilize buffers/slack time only for inherently risky tasks, not uniformly everywhere. Resource Leveling: If certain key personnel are drastically overbooked, shift secondary tasks deliberately based upon core priority rather than violently breaking tight operational deadlines. Rolling Wave Planning: Detail plan solely the forthcoming few weeks; keep chronologically distant tasks broadly estimated. This guarantees your Gantt overview stays beautifully clean. Track the official "% Complete" strictly based primarily upon work effort rather than basic elapsed calendar time. Ultimately better: Employ deep Earned Value methodologies whenever the core project scope is particularly multifaceted or demanding. Deploy distinct colors very sparingly: specifically for prominent milestones, critical phases, strictly delayed parameters, or totally completed workflows. This greatly fortifies readability. Firmly lock your fundamental Baseline directly before initiating large-scale structural changes, cleanly documenting all sequential modifications internally in your Change Log.
Good Project Metrics to Derive from Your Gantt
- Schedule Variance (SV) = Earned Value − Planned Value
- % Milestones delivered strictly on time
- % Tasks cleanly on time (or conversely, the exact count of aggressively delayed Tasks)
- Total functional Resource Utilization per team role
- Verifiable Progress directly vs. Initial Baseline (Calculated meticulously in days or specific percentages)
Advanced Strategic Applications
Deep Critical Path Analysis and "What-If" Scenario Building: Radically alter the specific duration of a chosen task and directly visually check the downstream ramifications across the board. Scenarios built primarily for deep Risk Assessment: Dynamically internally test very different specific duration sets rigorously via best/likely/worst modeling. Tight Integration with Core Task Execution Tools: Simply let your primary team smoothly continue working inside their beloved operational tools; safely ensure your overarching Gantt actively seamlessly synchronizes their updated status data accurately mapping directly to you. This holds chronological strategic Timelines thoroughly detached from deeply fragmented specific daily Detail work. Robust Actionable Exports: Use strict CSV files natively targeted for granular tabular Reporting, sharp crisp PNG/PDF packages meant uniquely for sweeping management presentations, or automatically directly configure real-time Task Creation securely in robust PM tools. Smart Combinations alongside Kanban Systems: Seamless deployment of overarching Gantt visuals cleanly establishing the high-level functional Roadmap perfectly united with rigorous Kanban deployments driving rapid daily operational tactical executions seamlessly.
Typical Heavy Mistakes You Must Frantically Avoid
- Burying too many minor details deep inside the structural Gantt – directly converting a beautiful planning asset into an intensely cluttered, messy liability.
- Altering fundamental Task Durations permanently without comprehensively Updating the established Baseline – strictly ensuring you violently lose deep historical administrative structural control.
- Establishing Tasks lacking intensely clear specific individual Owners – deep responsibilities fundamentally must remain instantly massively visible organization-wide.
- Allowing extensive durations utterly absent of regular persistent updates – The Gantt profoundly strictly visually ages incredibly fast internally whenever not persistently heavily cared for constantly.
- Irresponsibly openly ignoring fundamental existing organizational resource constraints – Chronological strict deadlines firmly remain purely genuinely perfectly realistic solely paired firmly natively combined seamlessly alongside direct factual resource availability calibration.
Conclusion – the core essential points you definitely must retain
- A Gantt chart deeply fundamentally visualizes your exact distinct project timeline efficiently exactly universally strictly mapped as horizontal bar charts specifically clearly vividly exhibiting targeted tasks, deep rigorous dependencies, securely fixed functional milestones explicitly plainly flawlessly clearly.
- Always use the 8 M framework alongside a clearly structured WBS before digging into the details.
- Prioritize the critical path; actively monitor critical tasks daily.
- Select tools depending on the size of the project: Excel for straightforward plans, MS Project or Smartsheet for complex projects.
- Utilize Procoli Mini for link-based collaboration with external partners and for automated evidence collection.
- Update your Gantt chart regularly and complement it with Risk Priority Numbers (RPN) or FMEA if project risks are high.
Sources & Expert Links
- Smartsheet – What is a Gantt Chart: https://www.smartsheet.com/gantt-chart
- Microsoft Learn – Gantt in Project: https://learn.microsoft.com/en-us/office/project/
- Atlassian – Gantt Chart Article: https://www.atlassian.com
- PMI – Scheduling & Time Management Resources: https://www.pmi.org