Ishikawa Diagram: Create a Cause and Effect Diagram Step by Step
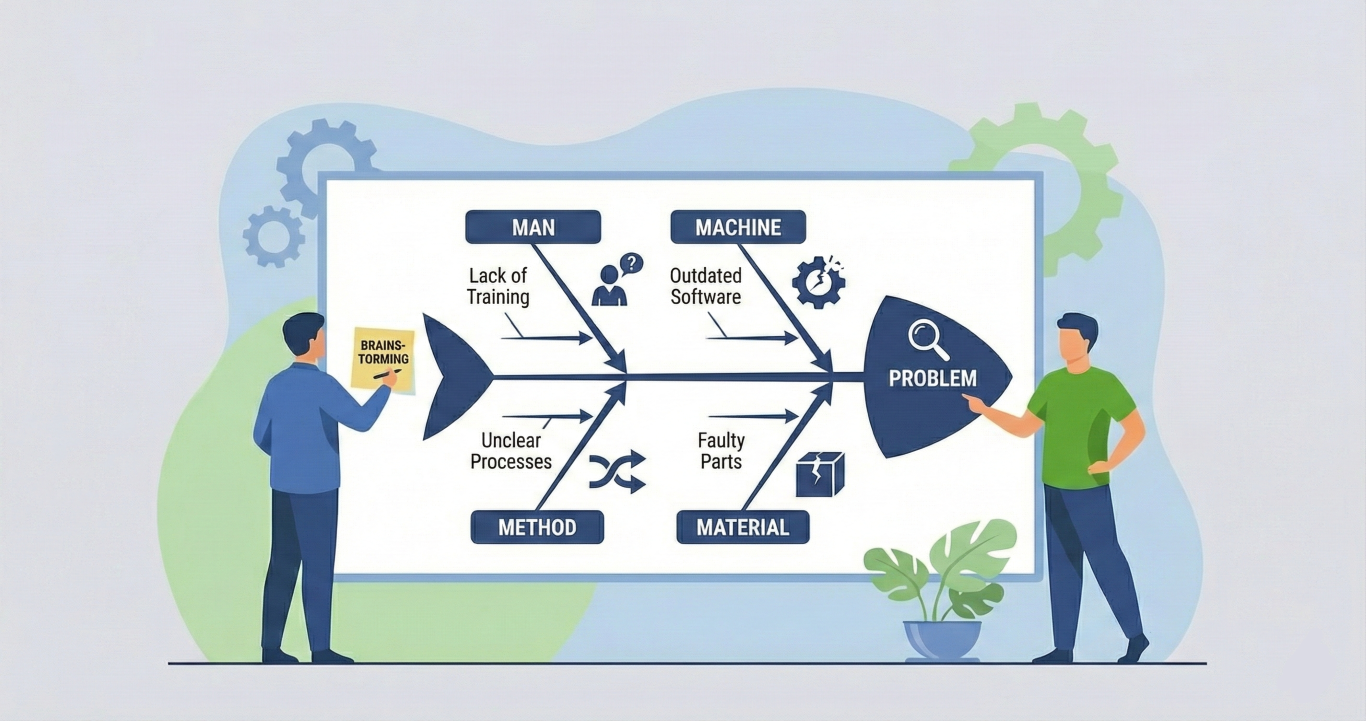
Here is the short version: Draw the problem as the head of the fish, arrange the 8 Ms as bones (spines), and collect concrete causes under them. This way, you identify the true root cause instead of just fighting symptoms.
In this article, I will show you step by step how to create an Ishikawa diagram (also called cause and effect diagram or fishbone diagram). You will learn how to identify and assess risks, how to effectively mitigate causes, and how to draw a clear fishbone diagram. Read on if you want to analyze problems systematically, prioritize the right causes, and use Procoli Mini to involve external partners directly in the solution process without registration.
You will learn a practical method for root cause analysis, receive an objective scale for FMEA risk analysis, and see how a fishbone diagram improves the visualization of cause-and-effect relationships. I will also give you concrete tips for implementation within your team.
What is an Ishikawa Diagram (Fishbone Diagram) and what is it used for?
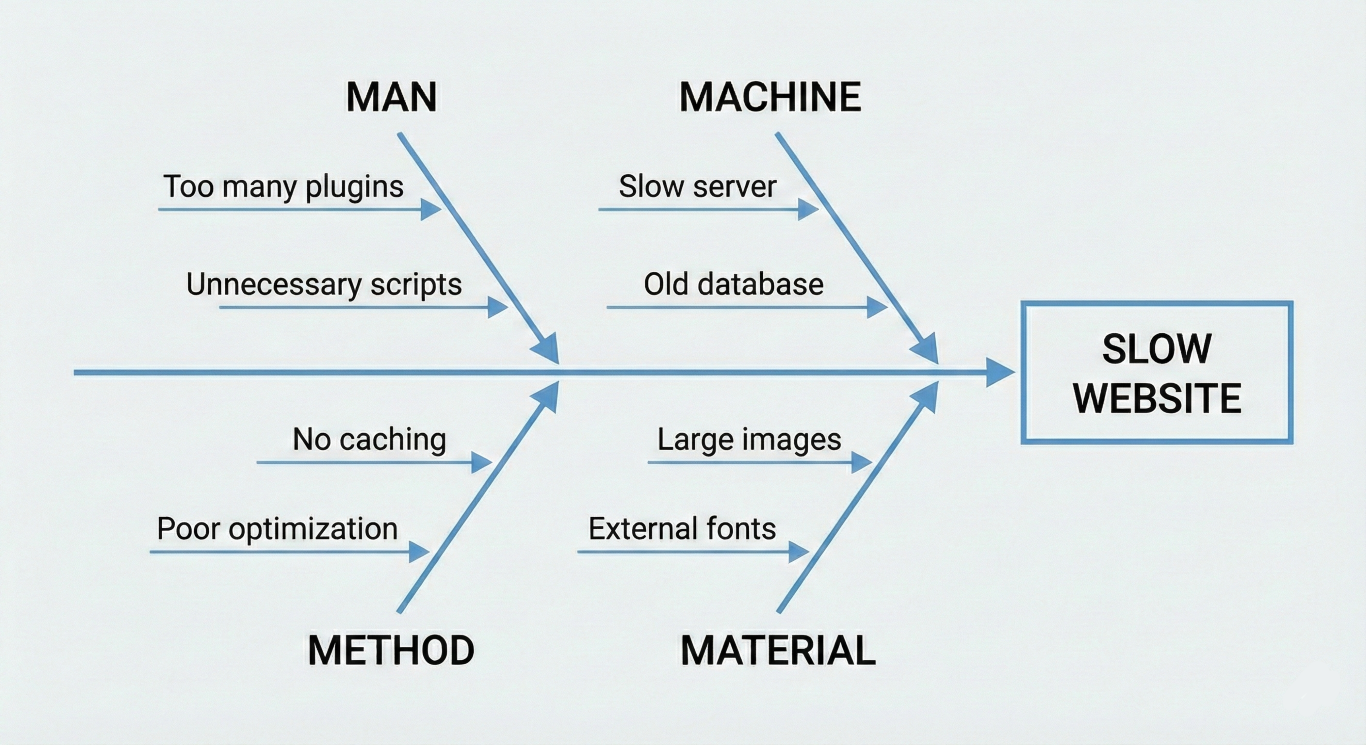
The Ishikawa diagram illustrates the causes of a problem graphically. Kaoru Ishikawa developed this method in the context of quality management to enable teams to systematically analyze and visualize the causes of a problem. A fishbone diagram arranges various influencing factors in a structured way and makes their importance and influence visible.
Use the Ishikawa diagram for quality problems, process errors, or in customer service. It transforms diffuse problem causes into a structured representation and reveals the interactions between different causes. This allows your team to work specifically on the main cause instead of just doctoring the symptoms.
"If problems and objectives are clear, your problems are half solved." — Kaoru Ishikawa
"The fishbone diagram helps to identify the many possible causes of a problem by sorting ideas into useful categories." — ASQ (American Society for Quality) Sources: JUSE - Ishikawa, ASQ - Fishbone Diagram
How to Create an Ishikawa Diagram?
Here is the short version: First, define the problem as precisely as possible and place it at the head of the fish. Then draw the spine and the bones of the fish and enter the concrete causes under each of these bones.
Step by Step:
- Define the problem precisely as the effect (head). An example: Instead of simply writing "Machine broken", note "Unit 3 fails weekly due to overheating". A precise problem formulation reduces the risk of pursuing false causes.
- Draw a horizontal arrow (the spine) and note the problem at the right end (the head).
- Now draw the main categories as bones. Use the 8 Ms as a standard for this (see below).
- Collect potential causes together in the team and enter them under the appropriate bones. Use short, concise keywords.
Tip for moderation: Conduct a time-limited brainstorming session. Initially note every cause without evaluation and mark the most plausible entries only later. This avoids premature evaluation and encourages creative contributions.
Why Does Creating an Ishikawa Diagram Help Solve Problems?
The cause and effect diagram 'forces' you to structure causes and make dependencies visible. In this way, you separate the main cause from mere secondary causes and recognize which influencing factors play the biggest role. This structured root cause analysis increases efficiency in problem-solving and reduces unnecessary scatter losses.
Use the diagram also as a basis for further methods such as FMEA risk analysis or significance tests. The Ishikawa diagram provides you with the hypotheses that you can subsequently confirm with sound data and tests.
Identify Possible Causes: Best Done in Team Brainstorming
Start by collecting possible causes in a structured brainstorming session. It is important that you use a clear problem formulation. Also set a time limit and use a template. The goal is to find all potential causes that generate the problem.
Pay attention to typical categories such as human errors, process gaps, technical errors, material defects, measurement deviations, and external influences (the environment). Note each potential cause as a hypothesis. Later, you then validate these hypotheses with data and measurements.
Practical Process:
- Start with a clear problem formulation.
- Collect all possible causes without evaluating them immediately.
- Group similar causes and assign them to the 8 Ms (see next section).
- Finally, select the most plausible causes for detailed evaluation.
How do you objectively evaluate the identified causes? (Scale & Matrix)
Evaluate the identified causes objectively using a 'Likelihood × Impact' scale from 1 to 5. Define a clear description for each level (e.g., 5 means: very frequent / catastrophic impact).
To do this, draw a risk matrix (Y-axis = Probability of the cause occurring, X-axis = Impact on the overall problem).
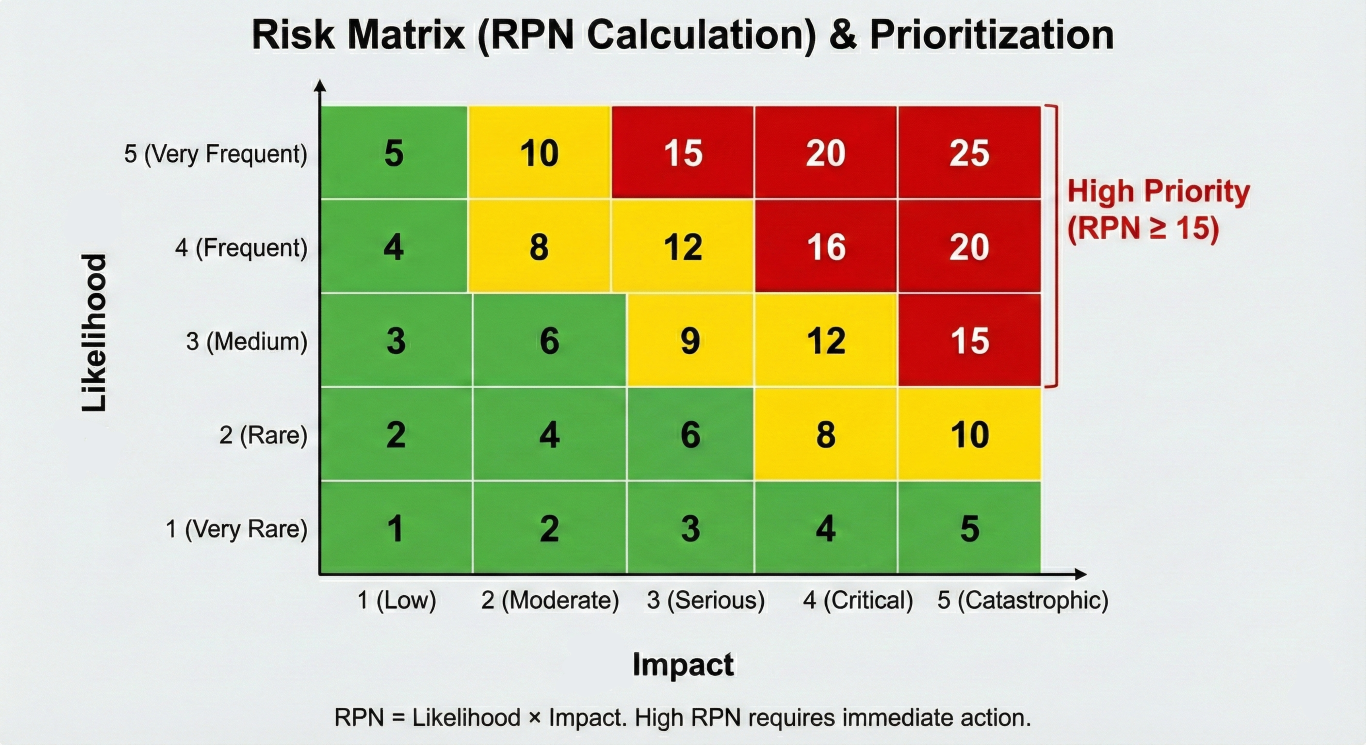
Now calculate the Risk Priority Number (RPN = Probability × Impact).
If the RPN is high, you should prioritize this cause as a potential root cause. Supplement this evaluation with a hazard assessment if safety-relevant causes are involved.
How do you find the causes and distinguish main causes from secondary causes?
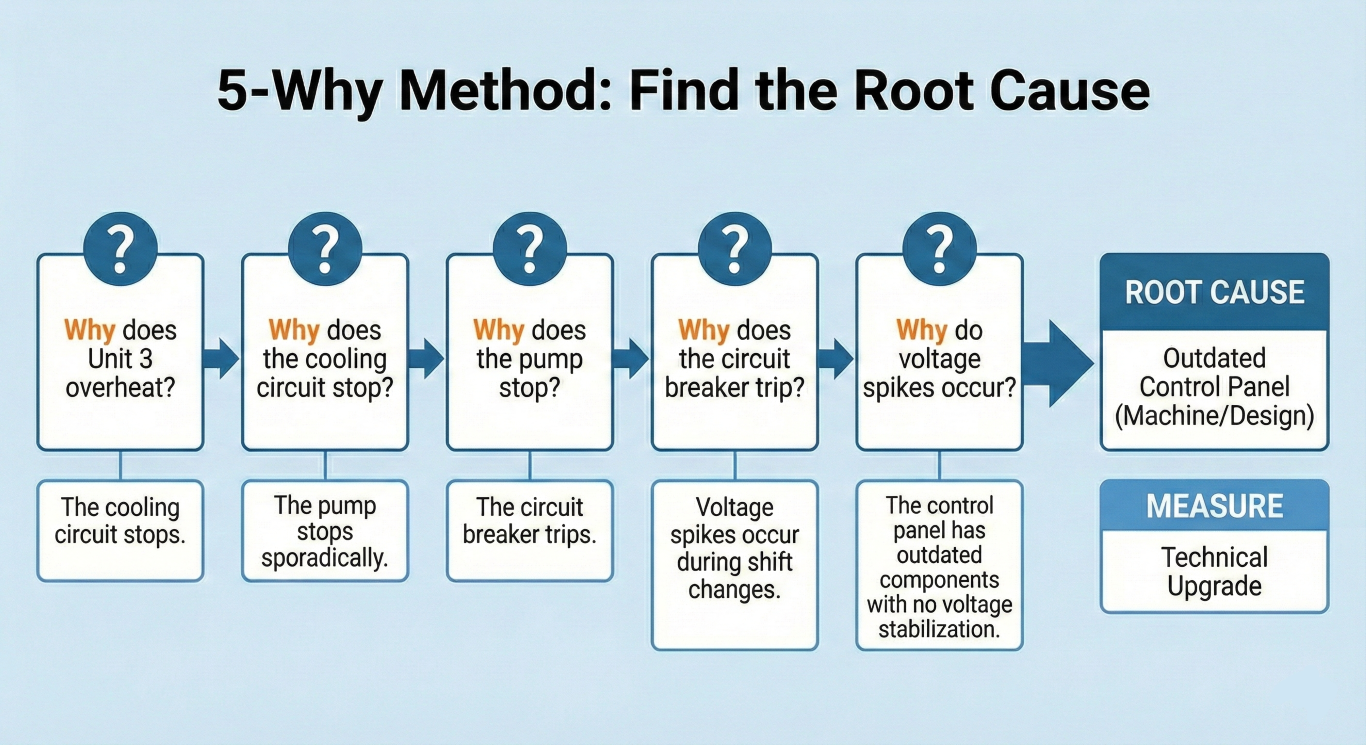
Systematically perform the 5-Why method. Ask "Why?" until you reach a cause whose elimination permanently reduces the effect. Note whether a cause directly causes the problem or whether it represents a secondary cause. Define the main cause as that cause whose elimination solves the problem most sustainably.
Supplement the 5-Whys analysis by classifying the causes according to the 8 Ms. Sort each found cause under one of the following main influencing factors:
- Manpower (People) – Lack of training, poor process design, fatigue
- Machinery (Machines) – Devices, software, design, maintenance status
- Material – Components, supply parts, raw materials
- Method – Processes, work instructions, procedural rules
- Measurement – KPIs, measuring instruments, data quality
- Mother Nature (Environment) – Surroundings, climate, delivery conditions
- Management – Guidelines, resource planning, communication
- Money (Means) – Budget, investments, cost pressure
Enter these categories as main bones in your Ishikawa diagram. Document the concrete causes under each bone and attach further sub-branches for secondary causes if necessary. For example, if many causes lie under "Manpower", you should address training or process problems. If, on the other hand, "Machinery" dominates, check the design and maintenance logs.
Practical 5-Why Example (Working Your Way to the Root Cause)
Problem: Unit 3 fails weekly due to overheating.
- Why does Unit 3 overheat? → The cooling circuit stops.
- Why does the cooling circuit stop? → The pump stops sporadically.
- Why does the pump stop? → The circuit breaker trips.
- Why does the circuit breaker trip? → Current spikes occur during the shift change.
- Why do current spikes occur? → The control panel has outdated components without voltage stabilization.
Result: The root cause is an outdated control panel (Machinery/Design). Measure: Technical retrofit instead of employee reprimand.
Validate each cause with data, such as logs, measured values, maintenance protocols, or customer feedback. A cause without data remains merely a hypothesis; only data-based causes become actionable root causes.
How to Effectively Mitigate Causes? (Planning Measures)
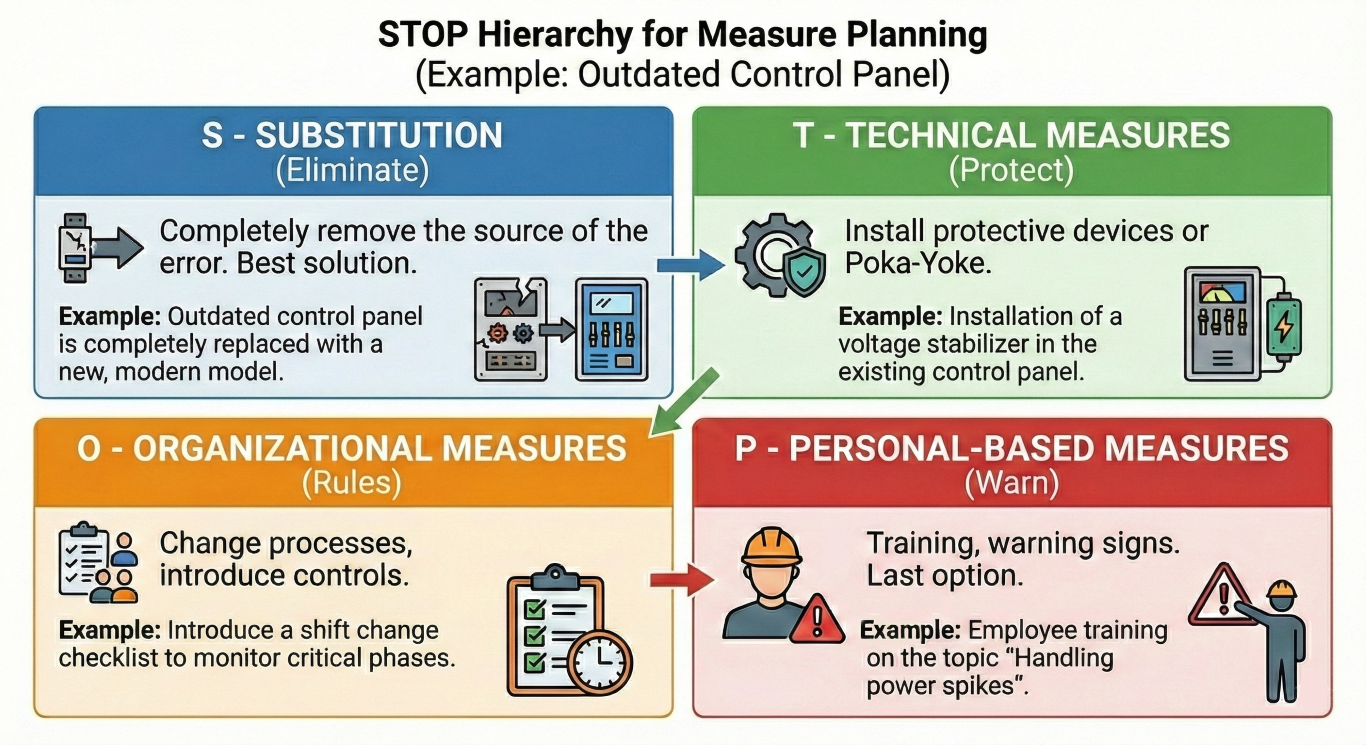
After identifying the main cause, plan effective measures. Use the S-T-O-P hierarchy to ensure the effectiveness of the measures, and formulate each measure according to the SMART principle:
S-T-O-P (Prioritization of Effectiveness)
- S — Substitution / Elimination:
Remove the source of error completely (this is the best solution). - T — Technical Measures:
Install protective measures or Poka-Yoke (e.g., protective caps or software restrictions). - O — Organizational Measures:
Change processes, set control points, or introduce the 4-eyes principle. - P — Personal Measures:
Training, behavioral rules, or warnings (this should be the last option).
SMART Formula (Concrete Measures)
You can find more about the SMART formula in our article Defining SMART Goals.
- S — Specific:
Weekly check of belt tension by shift supervisor, documented in maintenance log. - M — Measurable:
Number of checks / error reduction in % - A — Achievable (Actively influenceable):
Knowledge / skills available - R — Realistic:
Resources available or planned - T — Time-bound:
Start from week 12, review after 8 weeks
Set responsibilities, deadlines, and metrics, and document each measure in an action plan. Prioritize measures according to the RPN (Risk Priority Number). Also pay attention to dependencies: A measure can influence secondary causes or create entirely new effects.
Template for Creating the Cause and Effect Diagram and Step-by-Step Guide
Here are the practical steps for you:
- Draw a horizontal arrow leading to the problem (the head).
- Draw eight main categories as diagonal bones (use the 8 Ms here too).
- Enter the concrete causes in keywords under each main influencing factor.
- Add secondary causes as smaller branches.
- Mark the "Candidate Root Causes" in color or with symbols and note the RPN values next to them.
Visual Tips:
- Use colors for the main cause candidates.
- Keep keywords short and concise.
- Create a digital version (e.g., as SVG or PDF) for sharing after the workshop.
- Attach evidence under each branch (Log ID, date, photo link).
A well-drawn diagram helps to visualize complex causal relationships and is the ideal basis for FMEA risk analysis input.
How do you use Procoli Mini for Creating and Coordinating the Ishikawa Diagram?
Procoli Mini accelerates your implementation: Simply create the task "Ishikawa Workshop", invite external experts via link (completely without registration), and attach the diagram template. This way you collect input directly in the task.
Concrete Way of Working with Procoli Mini:
- Digital Brainstorming: Share the template, and external partners add their causes directly in the web view.
- Measure Tracking: Convert S-T-O-P measures into tasks, assign responsibilities and deadlines.
- Evidence Check: Request proof documents (such as photos or log extracts) in the task and have automated notifications sent.
- Transparency: Everyone sees the updates, comments stay in the right place, and external partners participate without registration.
Procoli Mini thus reduces friction losses in risk management and improves the tracking of cause elimination.
How do you measure the impact and success of problem solving?
Define measurable metrics before the measure, such as error rate, lead time, customer complaints, or downtime. Measure these values before and after implementation of the measure (Baseline vs. Post-Measure) and calculate the improvement in percent.
Use the RPN trend for quantification: A reduction in RPN indicates impact. Document all changes in the Ishikawa diagram and mark the tested causes. Supplement the analysis with significance tests if you need statistical assurance.
If measures are very expensive or safety-relevant, perform an FMEA risk analysis and prove the effects statistically before investing larger sums.
Additional Notes on Systematic Root Cause Analysis and Summary
- Use FMEA risk analysis and significance tests if risks are high.
- Involve the team early to effectively use creativity techniques like brainstorming.
- Pay attention to a clean graphic in the presentation: A clear fishbone layout makes later reviews much easier.
- Document every cause and every measure carefully so that the knowledge base grows.
Practical Template (Short Version)
- Head: Problem (clear problem formulation)
- Main Categories: Manpower, Machinery, Material, Method, Measurement, Mother Nature (Environment), Management, Money
- Under each branch: Concrete causes (keywords)
- Evaluation: Likelihood × Impact (1–5) → RPN
- Measures: Responsible, Deadline, Metric (SMART), Effectiveness (S-T-O-P)
Practical Example: Customer Service Case Study
You analyze a recurring complaint in customer service (problem). During brainstorming, potential causes appear: unclear process instructions, outdated FAQs, lack of employee training, wrong product description. With the Ishikawa diagram, you sort causes under the 8 Ms, evaluate each cause, use 5-Why for depth, and identify the main cause: missing standard work instruction. You set S-T-O-P measures, document them in Procoli Mini, and measure the reduction of customer complaints after 8 weeks.
Avoid Common Mistakes
- Do not collect causes without data; instead, validate every cause with measured values or logs.
- Do not prioritize based on gut feeling alone; use objective scales.
- Do not forget secondary causes; several small causes often lead to the effect.
- Document measures as tasks (e.g., in Procoli Mini) and request evidence.
Key Points at a Glance (Bullet Point Summary)
- Define the problem clearly as the effect (at the head of the diagram).
- Collect possible causes systematically via brainstorming.
- Create an Ishikawa diagram with clear main categories and enter the causes there.
- Use 5-Why, assign causes to the 8 Ms, and validate each cause with data.
- Evaluate each cause objectively with a 1–5 "Likelihood × Impact" scale and calculate the RPN.
- Prioritize measures according to the RPN and set effective S-T-O-P measures.
- Document everything in Procoli Mini for efficient link-based collaboration.
- Measure the impact with clear metrics and document results in the diagram.
FAQ
What is an Ishikawa Diagram and what needs do I consider?
The Ishikawa diagram (fishbone diagram) visualizes the possible causes of a problem and sorts them into main categories so that you find the root cause instead of just treating symptoms.
How do I quickly create an Ishikawa Diagram?
Define the problem precisely as the head, draw the spine, add the 8 Ms as bones, and enter all potential causes as branches. Then prioritize with an RPN evaluation.
How do I find the true Root Cause?
Use the 5-Why method: Ask "Why?" until you reach a cause whose elimination permanently stops the effect. Then verify the hypothesis with measurement data or logs.
How do I assess risks objectively?
Evaluate each validated cause with a Likelihood (1–5) and an Impact (1–5). Multiply the values to get the RPN and prioritize the measures according to the highest RPN.
Which main categories (8 Ms) do I use in the diagram?
Use: Manpower, Machinery, Material, Method, Measurement, Mother Nature (Environment), Management, and Money – these main influencing factors systematically cover the possible causes.
Which measures really work? (S-T-O-P)
Prioritize measures according to S-T-O-P: Substitution (eliminate) → Technical → Organizational → Personal. Formulate each measure SMART and track implementation as well as evidence.
How do I measure the success of problem solving?
Define KPIs (e.g., error rate, downtime, customer complaints) before the measure, measure the baseline, and compare them at fixed intervals. A reduction in the RPN also indicates effectiveness.
How do I involve external partners without hurdles?
Use link-based collaboration (e.g., Procoli Mini): Create the Ishikawa task, send the link via email, and external partners add input and evidence directly in the web view – completely without registration.
Advantages and Disadvantages of an Ishikawa Diagram
Advantages
- Visual Clarity: You see causes and interactions at a glance.
- Team Alignment: Brainstorming and moderation promote common understanding.
- Structure for Prioritization: It provides input for RPN, FMEA risk analysis, and further analyses.
- Low Cost: You only need paper/whiteboard or simple digital templates.
In short: The diagram accelerates finding causes and delivers directly actionable hypotheses.
Disadvantages / Countermeasures
- Danger of Symptom Treatment: Without 5-Why and data validation, often only symptoms are stopped. → Countermeasure: Always use 5-Why plus data collection.
- Dependent on Expert Knowledge: Lack of expertise delivers incomplete lists of causes. → Countermeasure: Add external experts (e.g., via Procoli Mini).
- No Statistical Verification: The diagram shows hypotheses, but no significance. → Countermeasure: Use significance tests or FMEA risk analysis for critical cases.
- Scope can become unclear: Too many causes make prioritization difficult. → Countermeasure: Cluster causes and calculate RPN values.